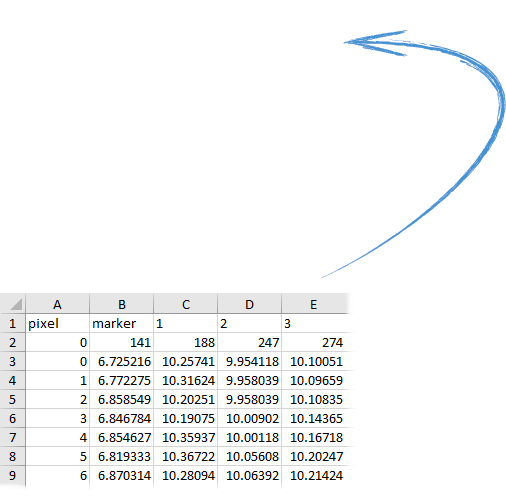
Upload file in a same format as example below:
1st column
– pixel number
2nd column
– marker intensities
3rd to the last column
– intensities of samples
1st row
- names of columns
2nd row
- pixel positions of the samples in the TRF scan
In case of too many peak maxima,
increase the value and vice versa.
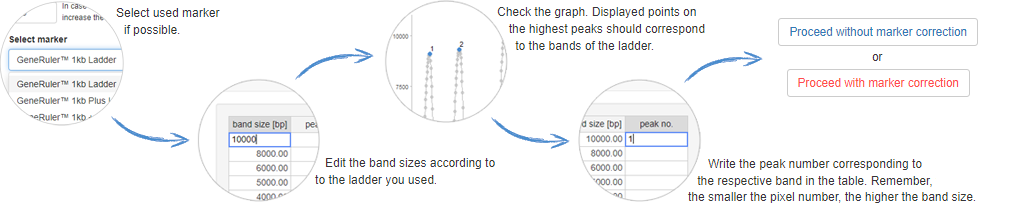
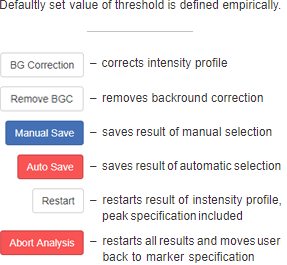
Don't know what to do? Follow the instructions below:
In case of too many peak maxima,
increase the value and vice versa.
Graph of the first marker:
Don't know what you should see?
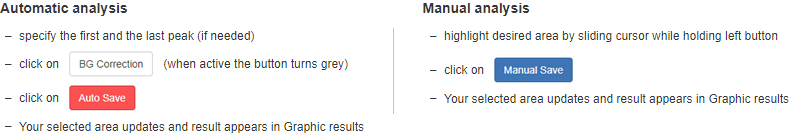
Specification of the first peak area:
Specification of the last peak area:
Your selected area:
Don't know what to do? Follow the instructions below: